What Is Power BI?
Power BI is a data visualization and business intelligence tool from Microsoft, first released in 2015. It makes data analysis and reporting easier for everyone, not just technical experts.
We're using Power BI for this data visualization course because, as of 2025, it's the most popular BI tool in the world.

... but it does mean we need to use Windows. shudder.
Oh come on now, Windows is fine.
Windows is huge in the business intelligence, accounting, and finance world, so it makes sense that Power BI is too.
With Power BI, you can connect to data from many different sources, transform it, and create dashboards and reports that help you understand your data quickly. Power BI is best known for:
- Interactive dashboards
- Ease of use
- Integration within the rest of the Microsoft ecosystem
- Data connectivity
- Sharing and collaboration
- Automation
It gives you the tools to explore, understand, and share information confidently – all in one seamless, interactive platform. In our opinion it's the best tool for learning real world data visualization skills.
Let's install Power BI Desktop on your machine!
Assignment
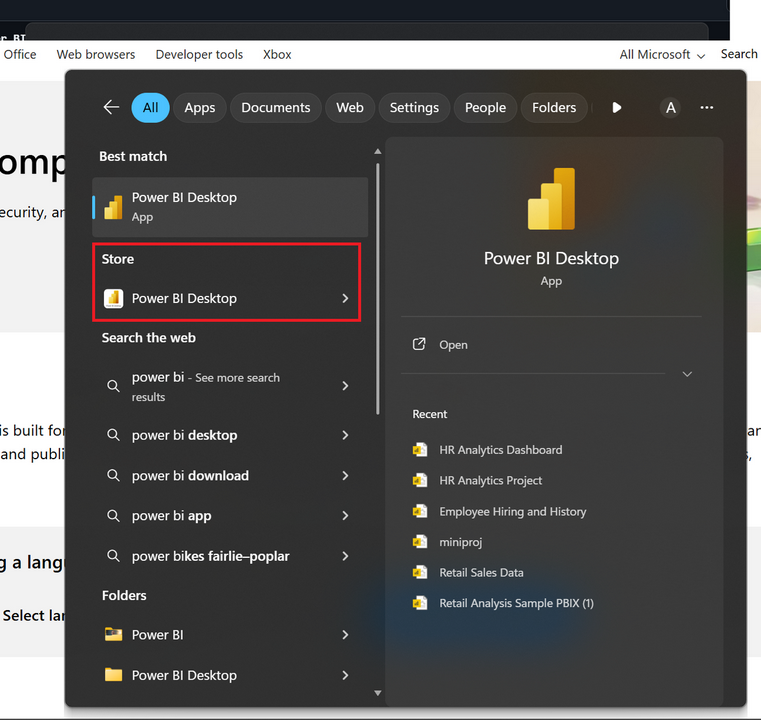
There are two main ways to download and install Power BI Desktop, which is the free version of Power BI that we'll use in this course:
-
From the Microsoft Store (recommended)
This version updates automatically whenever a new release is available.
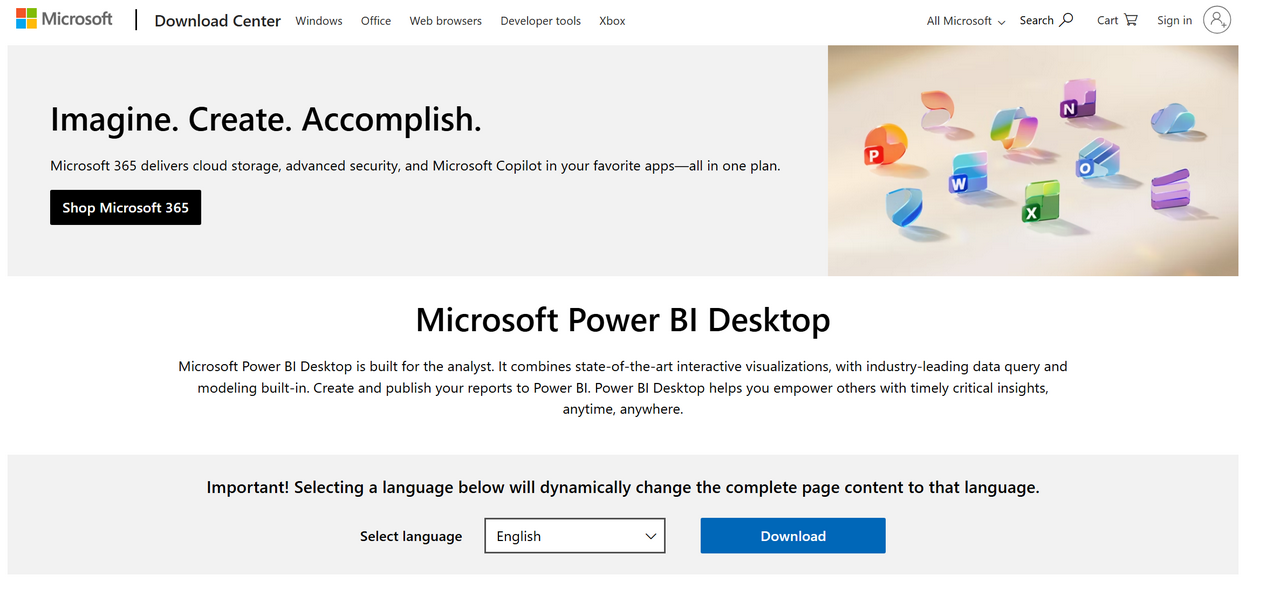
-
From the Microsoft website
Once Power BI is installed and you've verified that you can open the program, submit the CLI tests.